Join a powerful, unprecedented alliance for better eye health for all.
Join IAPBInequality in Vision Loss
Age
The risk of vision loss increases as you age.
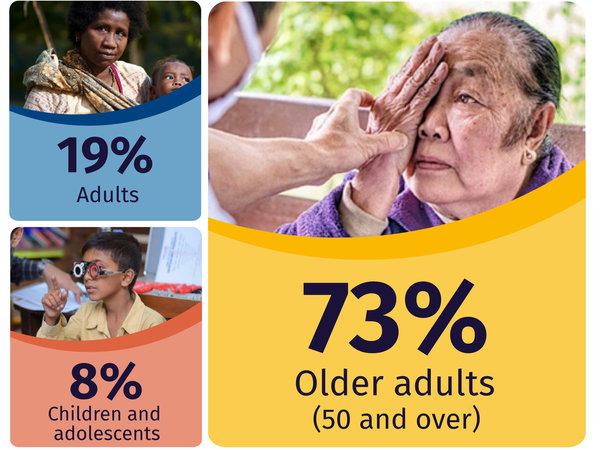 Vision loss increases with every decade of life
Cataract, presbyopia, age-related macular degeneration and glaucoma are all associated with ageing.
By 2050, it is anticipated that the proportion of the world’s population aged 65 years and over will double, increasing the prevalence of vision loss caused by these conditions.
However, most vision loss can be avoided with access to eye care services.

Chart description: The prevalence (crude) of all four categories of vision loss, by 10 years age groups in 2020. Adults 50 years and over, males and females.
Data from VLEG/GBD 2020 model.
The Global Coalition on Aging’s International Vision Health Scorecard
Healthy vision is at the center of healthy aging
(Opens in a new window) The Global Coalition on Aging’s (GCOA) International Vision Health Scorecard, supported by Roche, adds to concerted global health efforts to spur collective action on eye care and reduce preventable vision loss.The International Vision Health Scorecard aims to reframe how global society thinks about and takes action toward vision health and eye care to support healthier and more active aging.
The Scorecard explores how the following countries perform in distinct, yet interconnected categories that contribute to vision health and aging.
The categories are:
- National Commitment and Investment: including funding levels, national-level focus, and the commitment to robust, consistent data collection.
- Research and Innovation: considering the strength of IP protections, R&D funding, and the use of technology in diagnosis and care.
- Health System Preparedness: weighing a country’s capacity, the skills of its workforce, and its responsiveness to patients—in an effort to advance patient-centered care.
- Access: considering wait times for consultations and treatment, the distribution of the eye care workforce, and the cost of care.
- Prevention: weighing the coordination of care, interventions to reach at-risk populations, and efforts to increase awareness of eye diseases and symptoms.
- Societal Support: how well a country supports people with vision loss and prepares for demographic shifts, including non-discrimination policies and the development of age-friendly communities.
For more information on each category, please view the full International Vision Health Scorecard.
The individual category scores, in turn, determine the country’s overall score – all are listed in the following table (scroll right to view all six categories). The overall scores are also listed in the Vision Atlas country dashboard.
| Country | Overall score | National Commitment and Investment | Research and Innovation | Health System Preparedness | Access | Prevention | Societal Support |
|---|---|---|---|---|---|---|---|
| United Kingdom | 8.2 | 8.2 | 7.5 | 8.6 | 8.3 | 8.3 | 8.3 |
| Australia | 8.1 | 8.2 | 7.7 | 8.9 | 8.3 | 8.0 | 7.5 |
| United States | 7.6 | 7.1 | 8.4 | 7.2 | 7.5 | 7.6 | 8.3 |
| Sweden | 7.5 | 6.9 | 7.5 | 7.5 | 8.4 | 6.5 | 8.3 |
| Canada | 7.0 | 5.9 | 7.3 | 7.3 | 7.3 | 7.0 | 7.5 |
| Germany | 7.0 | 6.0 | 7.9 | 7.8 | 7.8 | 6.2 | 6.3 |
| France | 6.9 | 5.9 | 8.1 | 7.2 | 7.3 | 6.9 | 5.8 |
| Japan | 6.9 | 6.2 | 8.2 | 6.7 | 7.6 | 5.5 | 7.2 |
| Switzerland | 6.9 | 5.1 | 7.5 | 7.6 | 7.5 | 6.6 | 7.1 |
| Italy | 6.7 | 5.9 | 6.7 | 6.7 | 7.5 | 6.7 | 6.7 |
| Saudi Arabia | 6.5 | 6.9 | 6.2 | 6.9 | 6.4 | 7.0 | 5.8 |
| Spain | 6.4 | 5.5 | 6.8 | 6.7 | 6.3 | 6.0 | 7.5 |
| China | 6.2 | 6.4 | 6.2 | 6.1 | 6.3 | 6.3 | 5.8 |
| Brazil | 5.0 | 4.4 | 4.8 | 5.6 | 5.0 | 5.3 | 5.0 |
| Nigeria | 4.3 | 5.4 | 4.5 | 5.0 | 3.3 | 3.7 | 4.2 |
The Scorecard’s findings and calls to action aim to spur meaningful progress to improve vision health and ultimately advance healthy aging, enabling more people to remain active and productive for more years of their lives.
View the full International Vision Health Scorecard.
The International Vision Health Scorecard was produced by the Global Coalition on Aging and made possible through the generous support of Roche.


