Skip to content

Solutions

National indicators

National indicators help us track progress and focus efforts to reduce avoidable blindness and vision impairment world-wide.

Universal eye health: a global action plan 2014–2019 and national indicators

Universal eye health: a global action plan 2014–2019, adopted at the WHO World Health Assembly in 2013, set out objectives and means to significantly reduce avoidable blindness and vision impairment world-wide.

A global target was set to reduce the prevalence of avoidable visual impairment by 25% by 2019 from the baseline of 2010, along with several national indicators.
Since then, significant work has been undertaken to implement the plan.

Select the following bars to learn more about national indicators.

Universal eye health: a global action plan 2014–2019 stated that global targets and national indicators are important to provide clarity on the overall direction, track progress, focus efforts and for advocacy purposes.

National indicators also help the World Health Organization (WHO), Member States and their partners evaluate impact on ongoing eye care services and plan future investments.

In the Vision Atlas, we report data for the following three key indicators used to measure progress at the national level:

  1. Prevalence and causes of vision impairment
  2. Number of eye care personnel of different cadre; and
  3. Cataract surgical service delivery.

In addition to the three key indicators listed above, we also report on the:

  1. regional distribution in the geographic focus of eye health research
  2. number of countries that have completed an eye care service assessment
  3. number of countries that havenational eye health committees, coordinators and plans.

IAPB has collected information from Ministry of Health staff or other key respondents from 193 countries. Data have been collected semi-regularly since 2008.

All other data presented are from data reported in previous years or published data from several sources:

The following data analysis represents the available data as of December 2020. These data are limited due to the following factors:

  • Data have not been received for all years for all countries. For example, some countries last reported data 5 or 10 years ago.
  • Some countries don’t provide data for all indicators.
  • Data have never been collected for some countries.
  • Most data are not gender-disaggregated, except for Indicator 1 data.
  • There is no reporting on urban-rural or public-private divides.

The principle was to use the ‘most recent credible data’. It was challenging to source data updates from countries for 2019, partly due to the COVID-19 pandemic. In 2020, responses were received from 30 countries, who had all also reported data in earlier years.

There is considerable variation in data between individual countries and thus the median has been used to compare results between the GBD Super Regions. This places limitations on the conclusions one may draw, so the observations discussed here should be judged in the light of these limitations.

This summary is presenting data at GBD Super Region level, however country level data can be found on country dashboards. When considering an individual country, it is best to use available data at the country level, however comparing to GBD Super Region summary data may also be helpful.

If data is incorrect or missing from your country and you have access to updated data, we would love to hear from you at [email protected].

If you would like to jump directly to one of the following indicators on this page, you can use the following links:

Indicator 1: Prevalence and causes of vision impairment

These data are available in the Vision Atlas at GBD Super Region and GBD Region level. Prevalence data are also available at country level.

Indicator 2: Number of eye care personnel

Data have been collected for three cadres among the eye health workforce:

  • ophthalmologists
  • optometrists, and
  • allied ophthalmic personnel.

Reliability of data for indicator 2: number of eye care personnel is rated as Good, Fair or Poor, based on the following criterion:

  • Good: Cadre well defined and/or responses from almost all countries.
  • Fair: Cadre definition varies and/or responses from more than half of countries
  • Poor: Cadre poorly defined and/or responses from less than half of countries.

Global snapshots

Select the following bars to learn more about the number of personnel reported for cadres of the eye health workforce. You can also cycle through the images to view median number of personnel per GBD Super Region.

Global snapshot

  • Number of ophthalmologists: 238,653
  • Number of countries reported: 191
  • Reliability: Good, as ophthalmologists must be registered to practice
  • Limitations: No data on scope or hours of practice.

Summary

Data on the number of ophthalmologists were available for 191 countries. Confidence in the data is good as most ophthalmologists must be registered to practice. However, not all ophthalmologists are surgically active, and the data does not differentiate this.

Resnikoff et al. (2020) report that although the estimated global ophthalmologist workforce appears to be growing, there is a significant shortfall of ophthalmologists in low- and middle-income countries relative to growing, ageing populations.

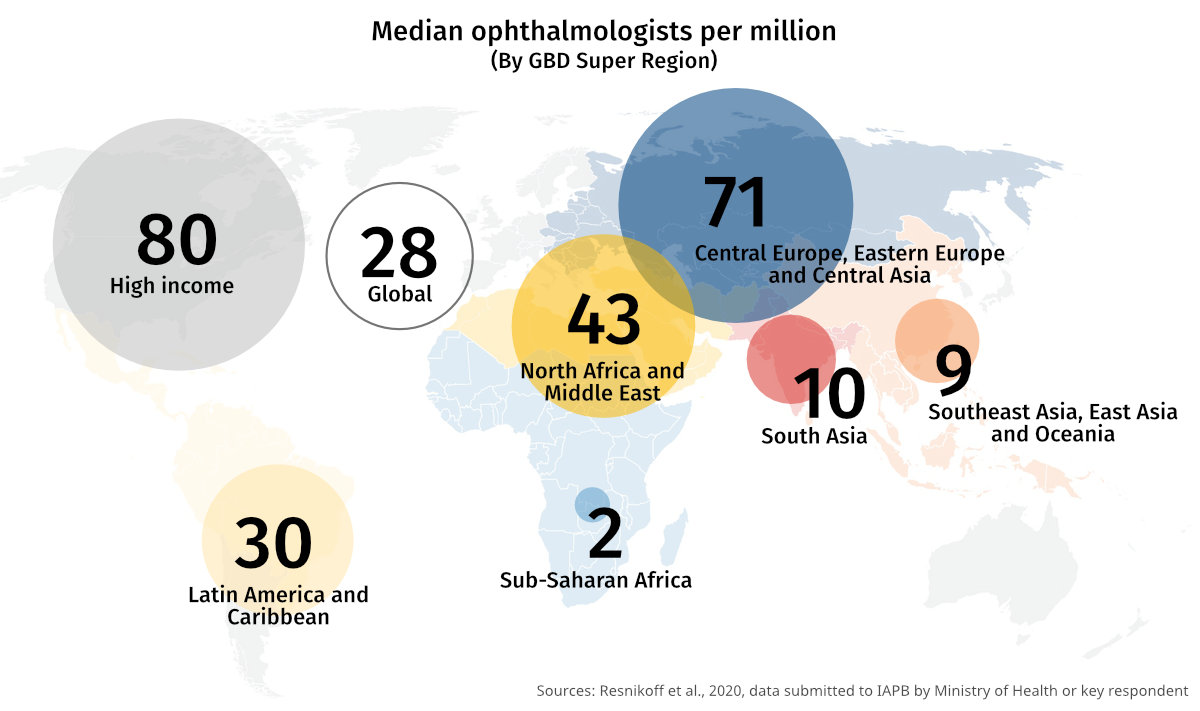
The first image in the carousel below shows the median number of ophthalmologists per million for each GBD Super Region. Super regions with a higher rate of vision loss tend to have fewer ophthalmologists, particularly Sub-Saharan Africa, South Asia, and Southeast Asia, East Asia and Oceania.

Global snapshot

  • Number of optometrists: 340,257
  • Number of countries reported: 159
  • Reliability: Fair to Good, although cadre definition varies, and registration is not always required.
  • Limitations: Definition of the profession varies between countries.

Summary

Optometrist data were available for 159 countries. Confidence in the data is lower than the ophthalmology data as registration is not required for optometrists in some countries, and the definition of who should be counted as an optometrist is less well accepted across the world.

Supplementary data on the number of optometrists was drawn from the WCO/WVRI/BHVI Global Optometry Human Resource Mapping Study. Only practitioners at Level 2 and above, which are considered by the WCO to be optometrists were included.

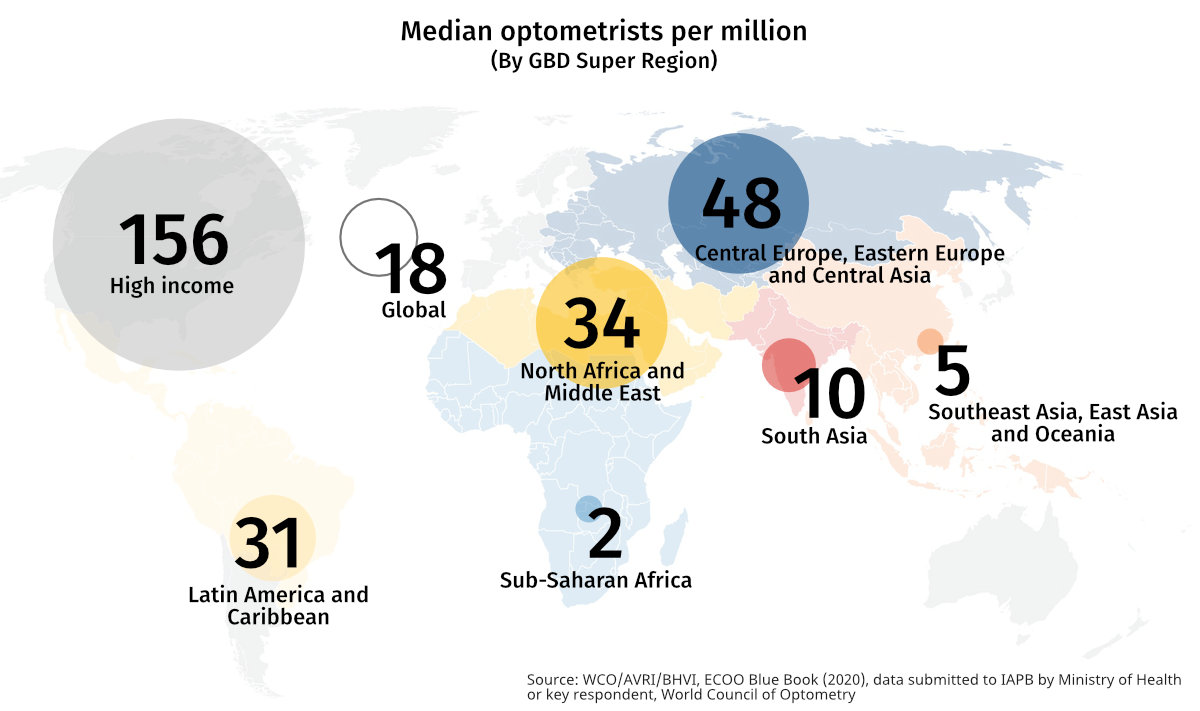
The second image in the carousel below shows the median number of optometrists per million for each GBD Super Region. We can see that there are very few optometrists relative to the population in some Super Regions, such as Sub-Saharan Africa, Southeast Asia, East Asia and Oceania, and South Asia.

Global snapshot

  • Number of allied health personnel: 218,779
  • Number of countries reported: 102
  • Reliability: Poor
  • Limitations: Definition of the profession varies widely between countries.

Summary

Allied ophthalmic personnel (AOP) data were submitted by 102 countries. Collecting data for the allied ophthalmic personnel (AOPs) has been challenging due to the considerable variation in definitions of AOP, as there is no internationally agreed understanding about who makes up this grouping. AOP can include professions such as orthoptists, ophthalmic assistants and ophthalmic nurses.

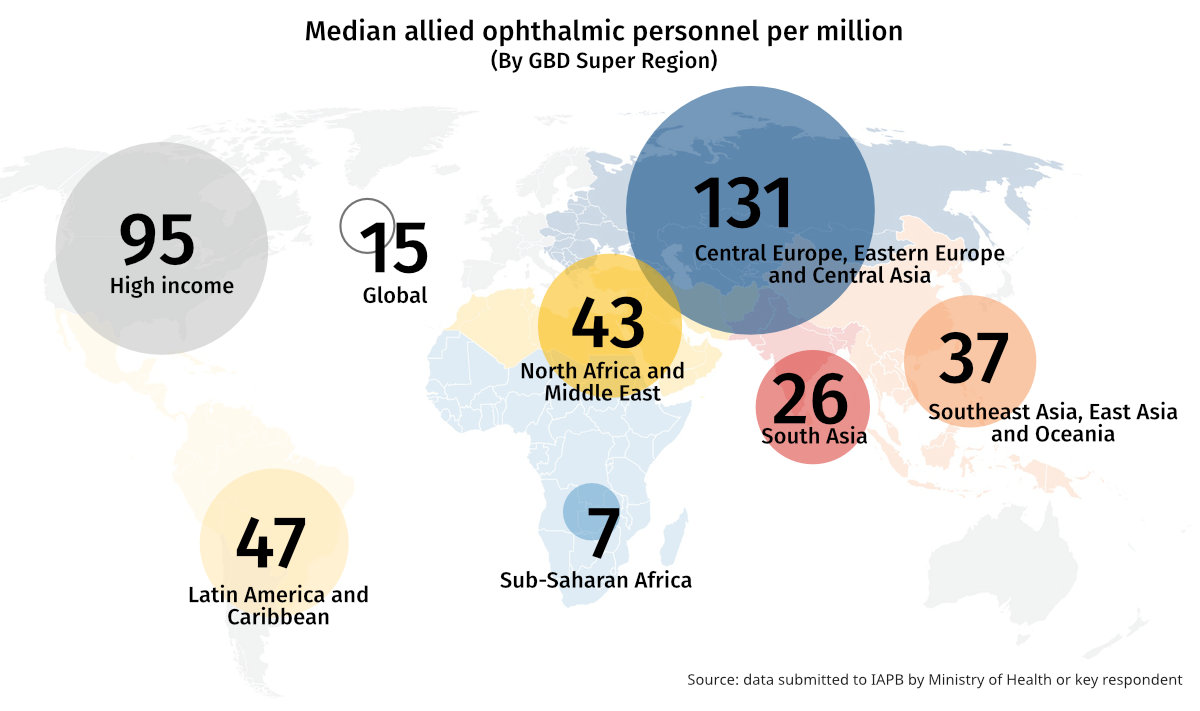
Critical human resource shortages exist for allied ophthalmic personnel, especially in Sub-Saharan Africa.

Graphic showing median ophthalmologists per million, with most ophthalmologists located in higher income regions.
Graphic showing median optometrists per million, with most optometrists located in the high income region.
Graphic showing median allied ophthalmic personnel per million, with most personnel located in higher income regions.
1/3

Indicator 3: Cataract surgical service delivery

Select the following bars and cycle through the images to learn more about cataract surgical service delivery around the world.

There are several indicators available for cataract service delivery:

  • Cataract surgical rate (CSR) is the number of cataract operations per million population per year. This was the first cataract indicator commonly reported.
  • Cataract surgical coverage (CSC) is the proportion of people with bilateral cataract and best corrected visual acuity of <3/60, <6/60 or <6/18 who have been operated upon in one or both eyes.
  • Effective cataract surgical coverage (eCSC) was first defined by Ramke et al. (2017), after the Global Action Plan had been launched. It is the proportion of people with bilateral operable cataract who have received cataract surgery in one or both eyes and have a ‘good’ postoperative presenting VA in at least one operated eye. The VA cut-off for operable cataract and a good outcome can be modified based on the context.

A high CSR alone may not reflect ‘good’ cataract services, so eCSC is a better indicator than CSR or CSC in terms of measuring the extent to which the need for cataract surgery in a population is being met by an eye health system. Data on eCSC are not yet widely available, but feature in the country dashboards for 20 countries (using operable cataract 6/60 and ‘good’ outcome 6/18) (Ramke et al., 2017).

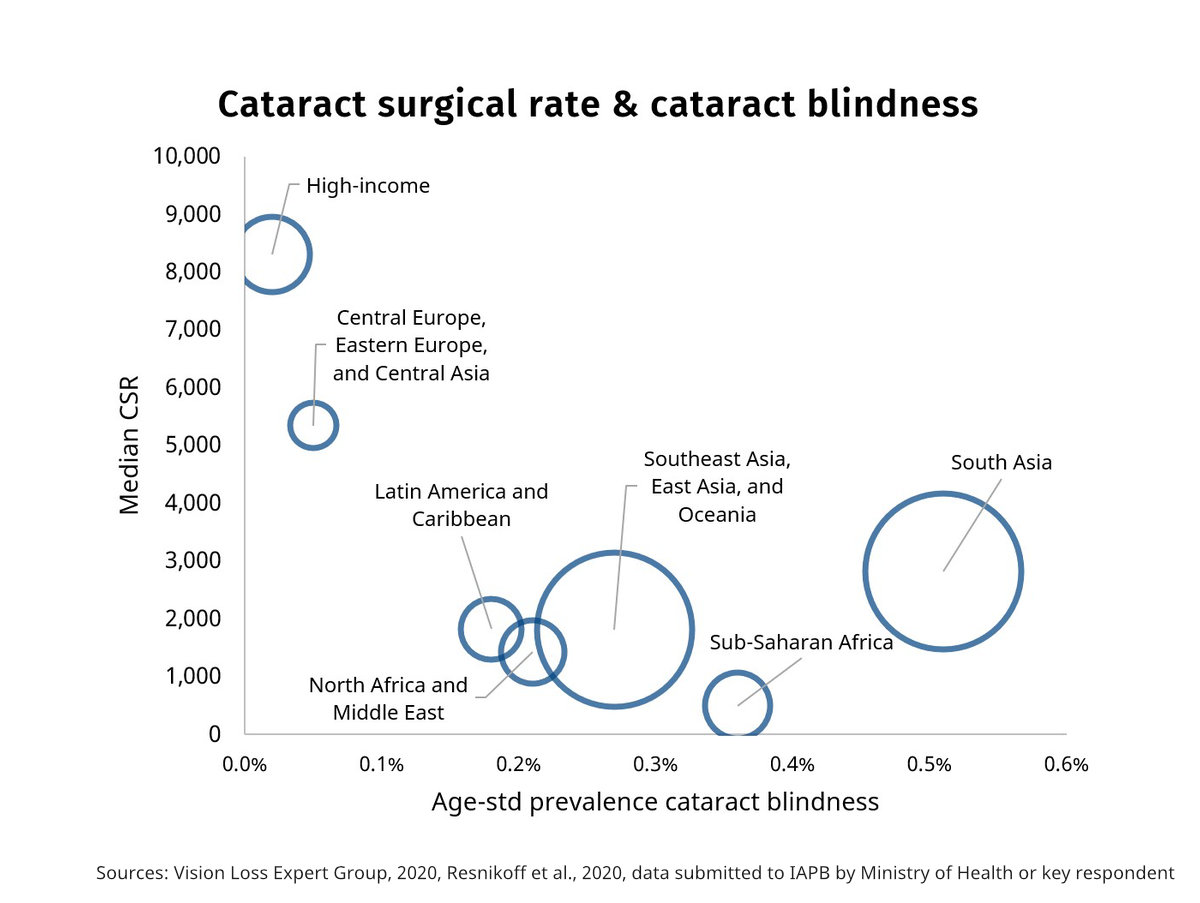
The most widely available data remains CSR data, obtained for 176 countries. The results in first image in the following image carousel emphasise the inequity of access to cataract surgery across the world, with less surgeries taking place in regions with higher levels of cataract blindness.

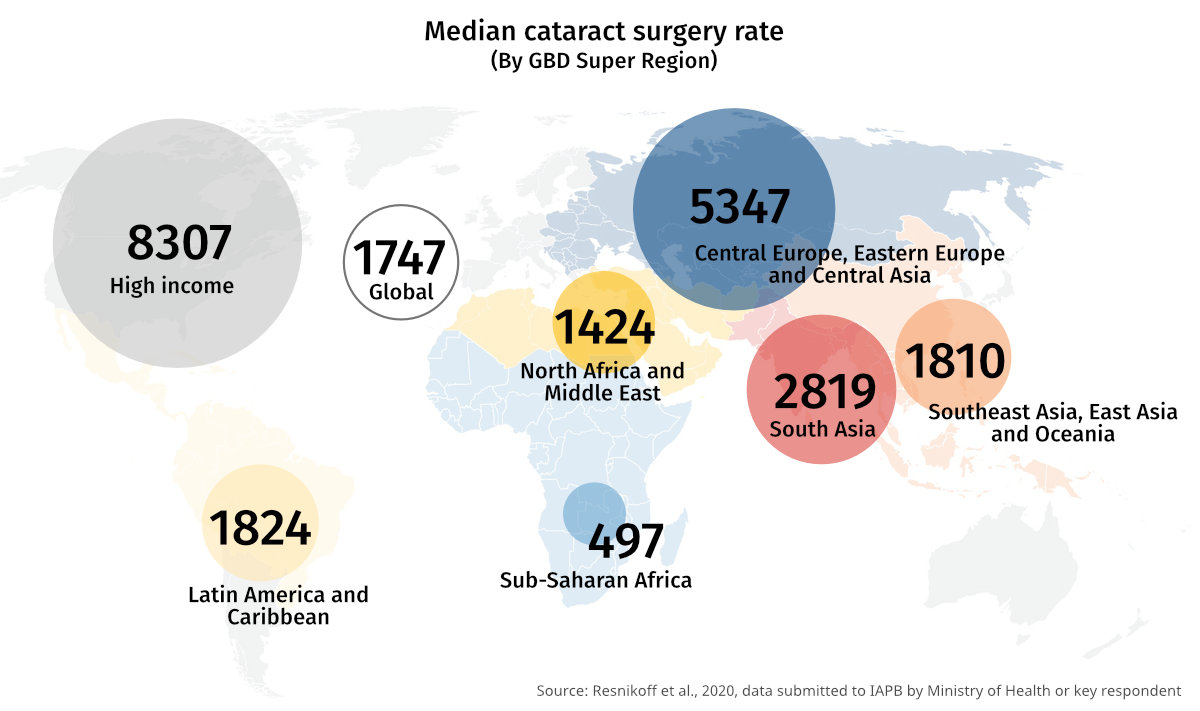
The median cataract surgical rate per GBD Super Region is shown in the second image in the following image carousel. The median CSR ranges from 497 (Sub-Saharan Africa) to 8307 (High-income). The global median was 1747.

Given the variation in the age profile of countries, it is accepted that CSR targets need to be set on a local basis. However, of the 176 countries for which we were able to collect CSR data, 56 had a CSR of less than 1,000.

Many low- and middle-income countries have achieved increases in rates of cataract surgery. For example, India was successful in increasing its CSR by almost nine-fold between 1981 and 2012, from just over 700 to 6,000 (Murthy et al. 2014). However, the prevalence of cataract blindness remains high in South Asia (Adelson et al. 2020).

1/2

Indicator 4: Eye health prevalence surveys

Eye health prevalence data surveys identify the prevalence and causes of blindness and vision impairment.

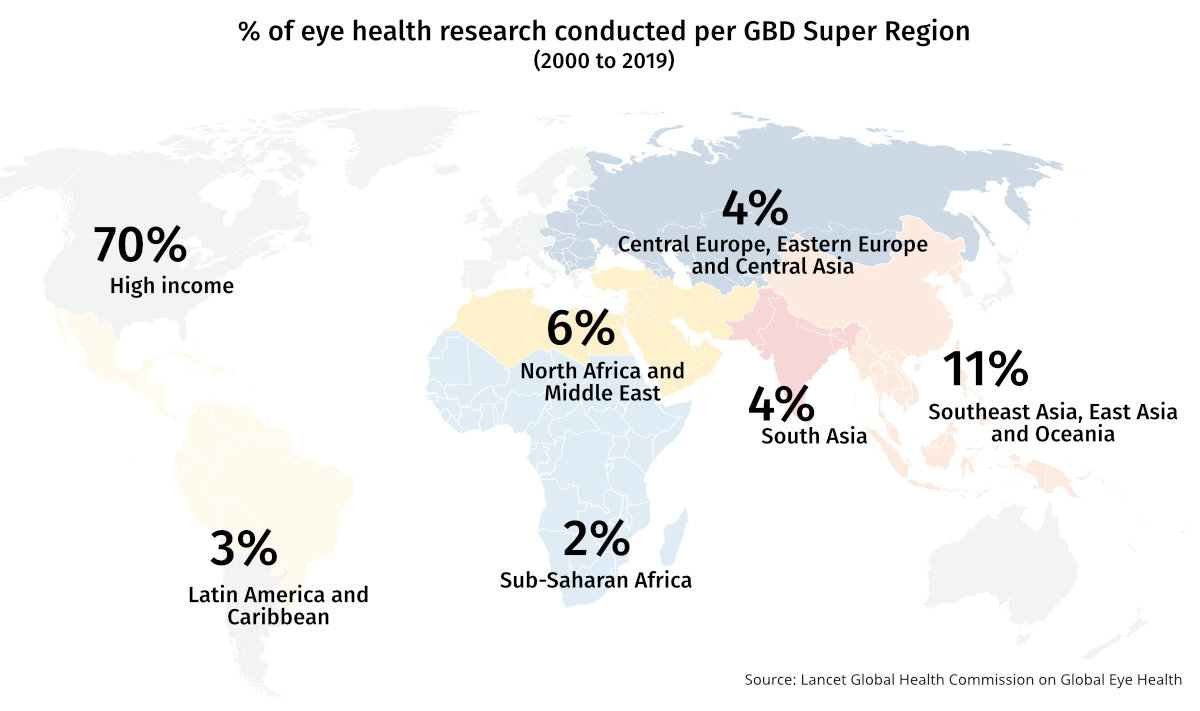
The Lancet Global Health Commission on Eye Health examined all primary peer-reviewed eye health research published between 2000 and 2019 through a systematic search of online databases.

They found there is a substantial maldistribution in the geographic focus of eye health research, shown below. Almost three quarters of reports are from high-income countries. Several regions, South East Asia, Latin America and the Caribbean, and Sub-Saharan Africa, had particularly low research output per capita.

Chart showing percentage of eye health research produced per GBD super region, with 70% of all studies originating in the High Income super region.
1/1

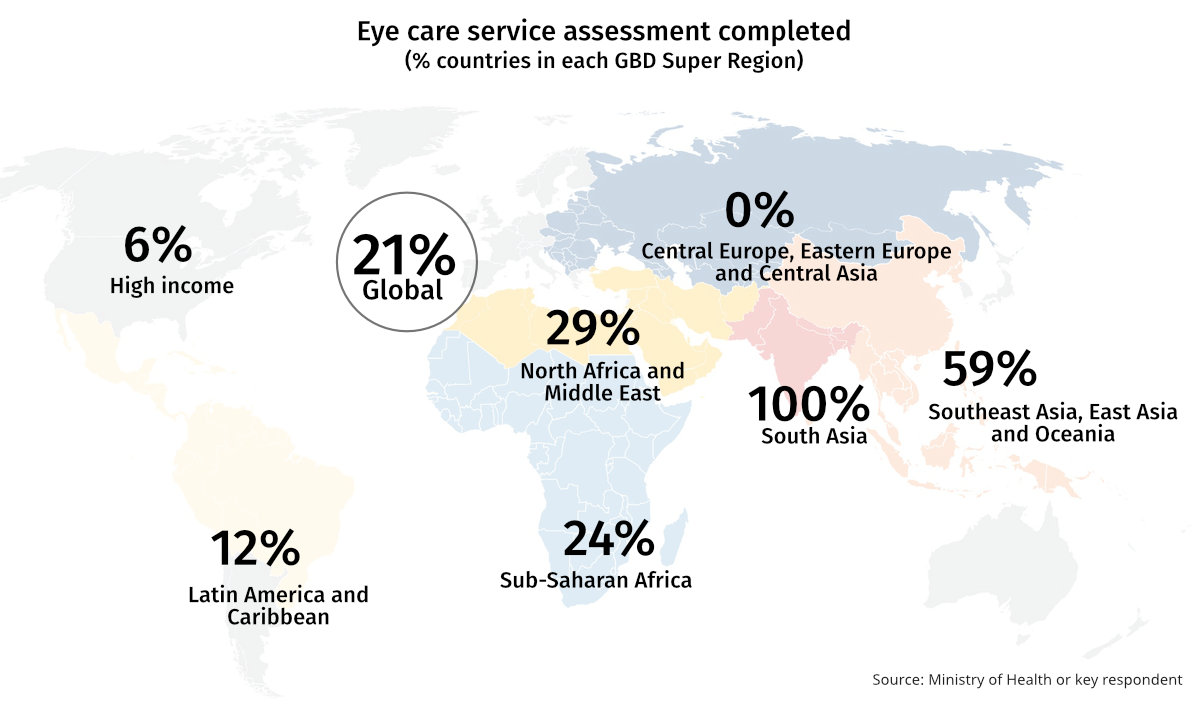
Indicator 5: Eye care service assessments

Eye care service assessment are used to assess the capacity of national eye health systems and to formulate policies and plans for eye health.

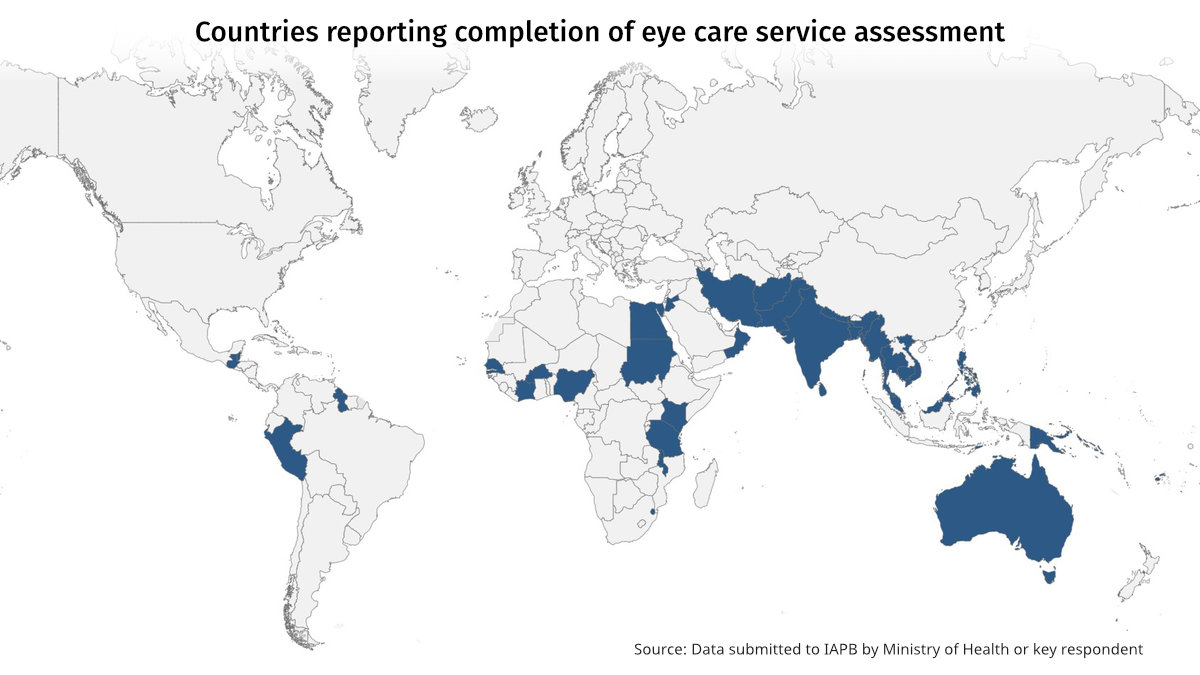
36 countries were identified as having completed the Eye Care Service Assessment Tool (ECSAT) and 4 countries have completed the older Eye Health Systems Assessment (EHSA) since 2012.

It’s important to also note that a new eye care situation assessment tool is in development at the World Health Organization (WHO) for future surveys.

The following two images indicate countries reporting completion of eye care service assessments around the world.

Map showing 40 countries reporting completion of eye care service assessment, mostly in Asia and Africa.
Map showing percentage of countries in each GBD SUper REgion reporting completion of eye care service assessments. Rates are higher in Asia and Africa, and close to 0% in high income countries.
1/2

Indicator 6: National eye health committees, coordinators and plans

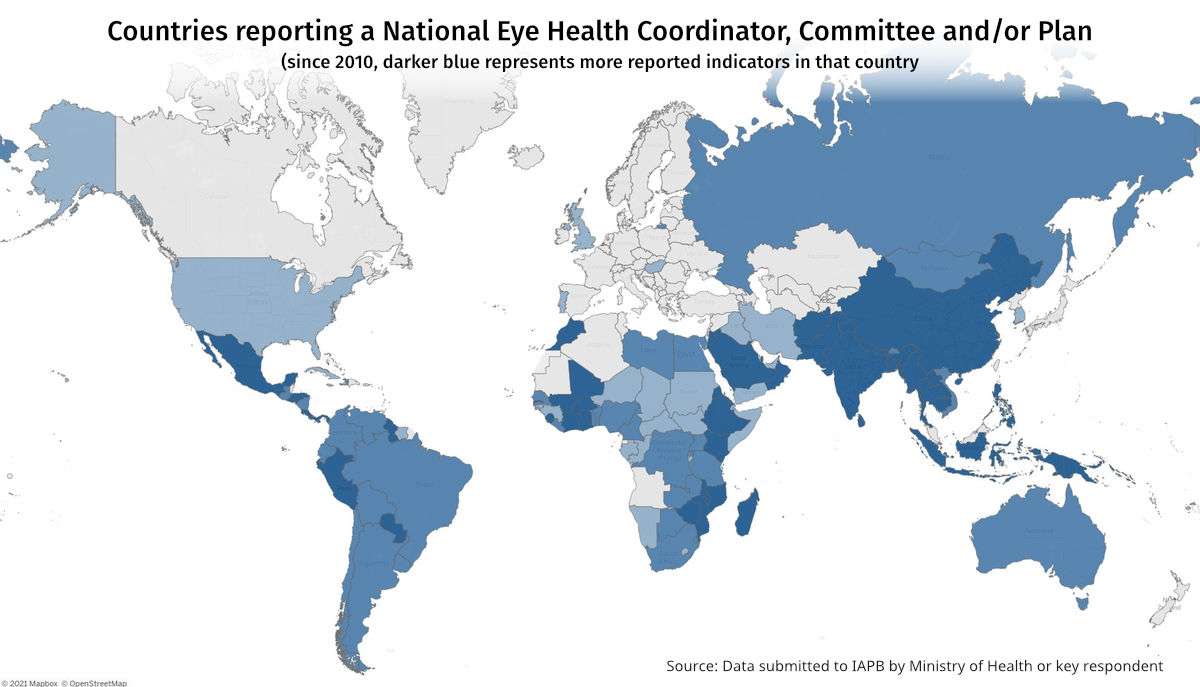
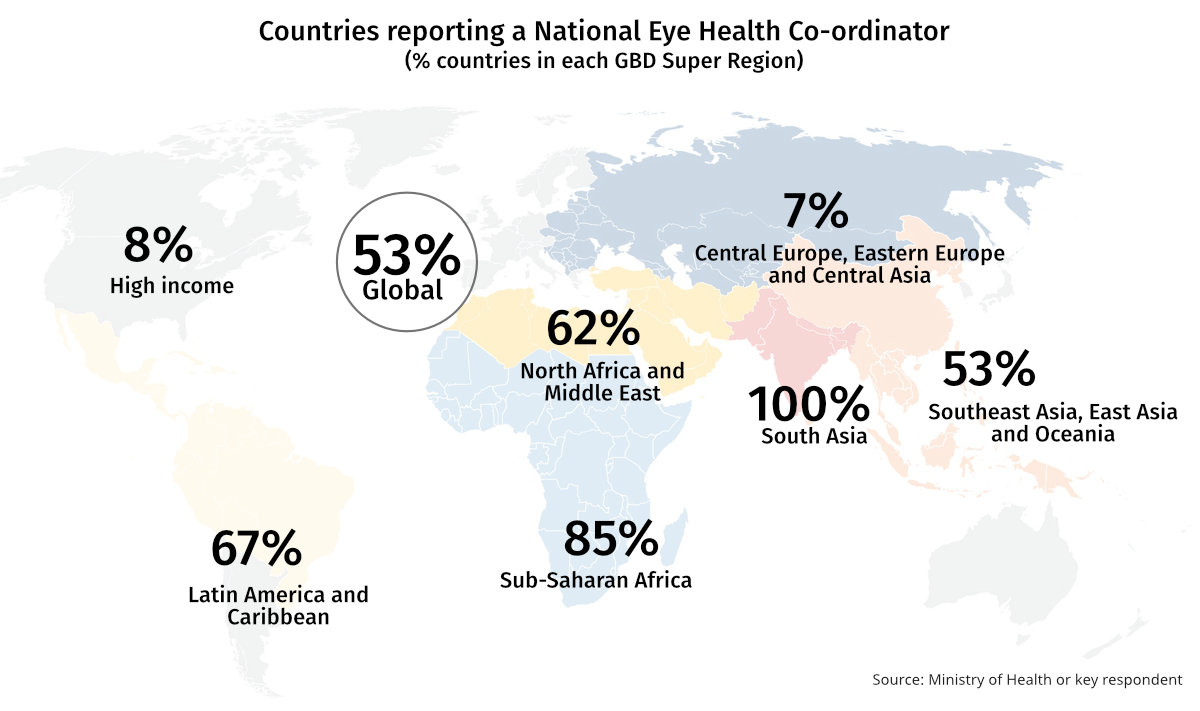
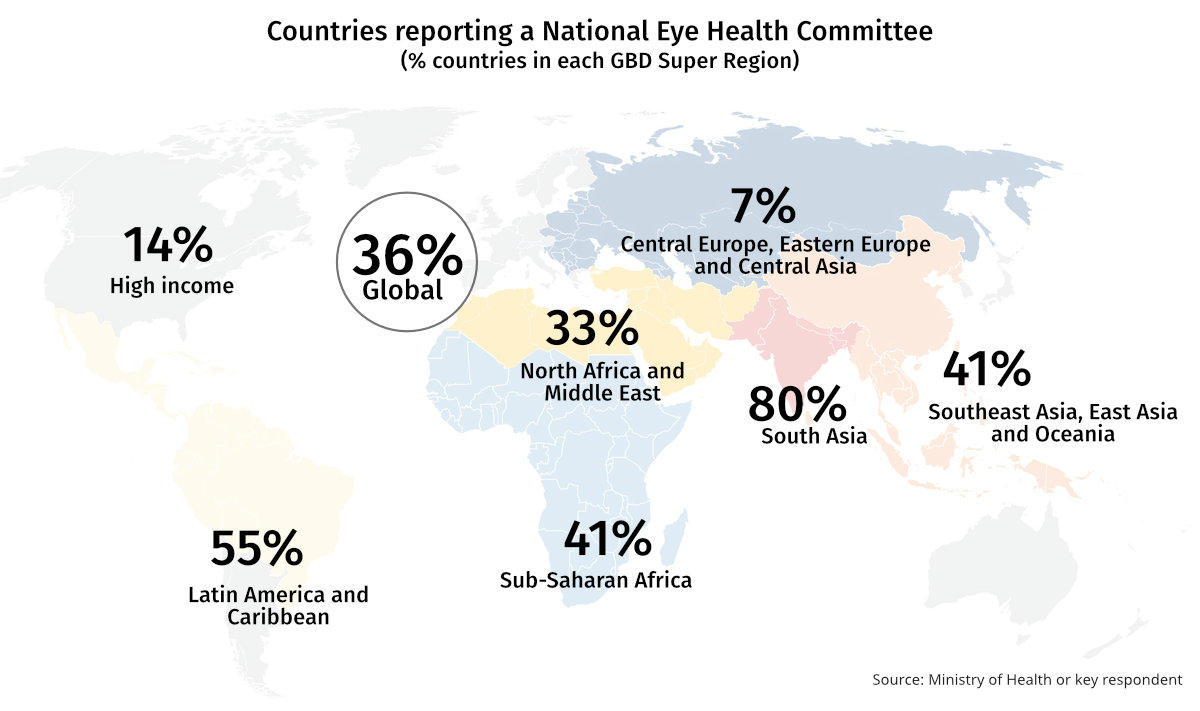
IAPB has reported the following data on national eye health policies, plans and programmes at any stage since 2010:

  • 102 countries have reported a National Eye Health Co-Ordinator for the prevention of blindness and vision impairment
  • 69 countries reported a National Prevention of Blindness Committee.
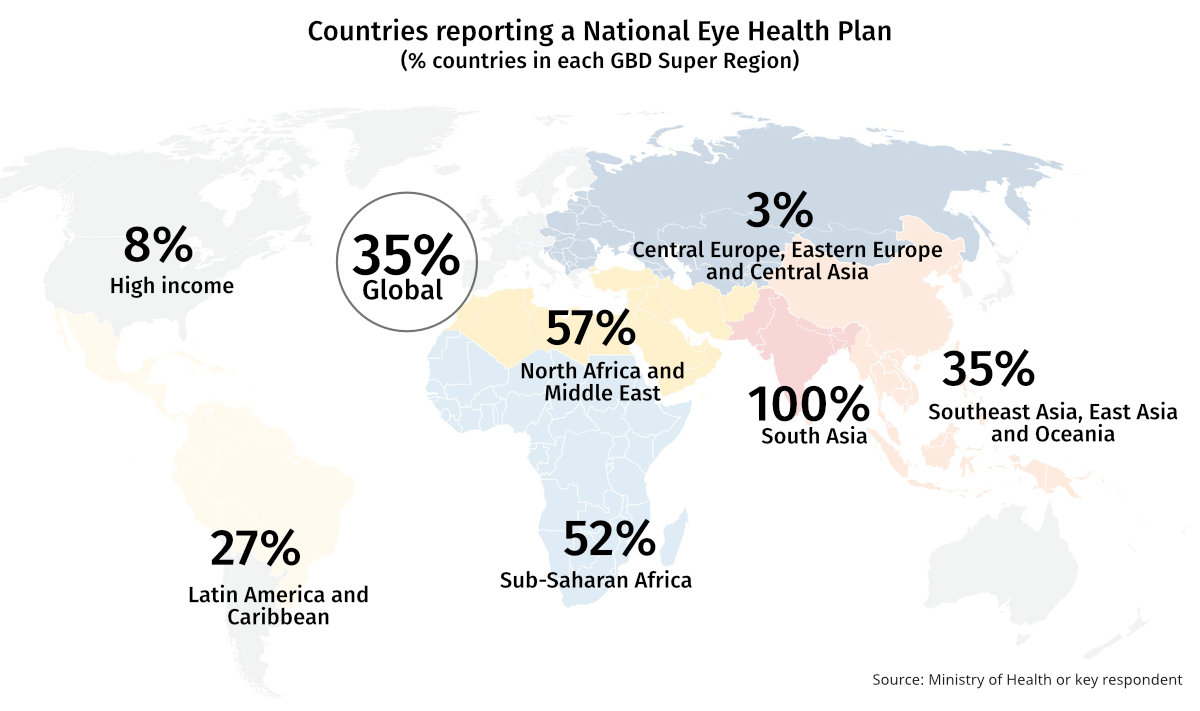
  • 67 countries reported a National Plan for Eye Health.

Select the arrows or swipe to view the countries reporting coordinators, committees and plans, including for each Super Region.

Given there are almost 200 countries, these may be considered relatively low numbers. This may be partially due to limitations in data reporting, however many countries do not have the planning mechanisms that the Global Action Plan called for to reduce avoidable vision loss.

Map showing Countries reporting a National Eye Health Coordinator, Committee and/or Plan. REporting is higer in Asia, Africa and Latin America, and low in Europe.
Chart showing Percentage of countries reporting a National Eye Health Coordinator in each GBD Super Region. Rates are high in Asia, Africa and Latin America and the Caribbean (50 to 100%), and low in High Income and Central Europe regions (7-8%)
Chart showing Percentage of countries reporting a National Eye Health Committee in each GBD Super Region. Rates are high in Asia, Africa and Latin America and the Caribbean (30 to 80%), and low in High Income and Central Europe regions (7-14%)
Chart showing Percentage of countries reporting a National Eye Health Plan in each GBD Super Region. Rates are high in Asia, Africa and Latin America and the Caribbean (30% to 100%), and low in High Income and Central Europe regions (3-8%)
1/4

New indicators

Both the Lancet Global Health Commission on Global Eye Health and the World Health Organization have recently worked on a comprehensive menu of indicators for the monitoring of strategies and actions for eye care provision.

Select the following bars to learn more.

The Lancet Global Health Commission on Global Eye Health in 2021 stated that reliable data are key to progress in eye health; robust indicator data are needed to shape change and drive action.

The Commission selected seven core indicators across four areas:

  • Accessibility of eye health services
  • Affordability of eye health services
  • Effective coverage of cataract and refractive error services
  • Prevalence of vision impairment.

The WHO is also set to develop a comprehensive menu of indicators that Member States can select from to facilitate the monitoring of strategies and actions for eye care provision at the national and sub-national level. The proposed targets and indicators will be accompanied by a monitoring system to ensure that the progress towards the targets can be measured and regularly reported on.

The recommended feasible global target for effective coverage of refractive error is a 40-percentage point increase in effective coverage of refractive error by 2030:

  • countries with a baseline effective coverage rate of 60% or higher should strive for universal coverage
  • countries should aim to achieve an equal increase in effective coverage of near and distance refractive error in all relevant population subgroups, independent of baseline estimates.

The recommended feasible global target for effective coverage of cataract surgery is a 30-percentage point increase in effective coverage of cataract surgery by 2030:

  • countries with a baseline effective coverage rate of 70% or higher should strive for universal coverage
  • countries should aim to achieve an equal increase in effective coverage of cataract surgery in all relevant population subgroups, independent of baseline estimates.

Looking forward

The Global Action Plan 2014-2019 indicators have helped to guide action over the past decade, however indicators featured in this report show that many barriers remain.

It is now time to focus on the future. In 2020, Member States cemented their commitment to the WHO World Report on Vision by adopting a World Health Assembly (WHA) resolution. The resolution commits countries to implementing integrated people centred eye care as part of Universal Health Coverage. The resolution directs the World Health Organization (WHO) Director-General to develop with Member States feasible global targets for 2030 on integrated people-centred eye care, focusing on effective coverage of refractive error and effective coverage of cataract surgery, for consideration by the Seventy-fourth World Health Assembly in 2021.

In addition, the first ever United Nations General Assembly Resolution on Vision is anticipated in 2021, placing vision on the sustainable development agenda and motivating action by the UN and its institutions.

It will also encourage a whole of government approach – all parts of government, especially those responsible for health, education, economic development and women’s issues, working together with civil society and the private sector on eye care.