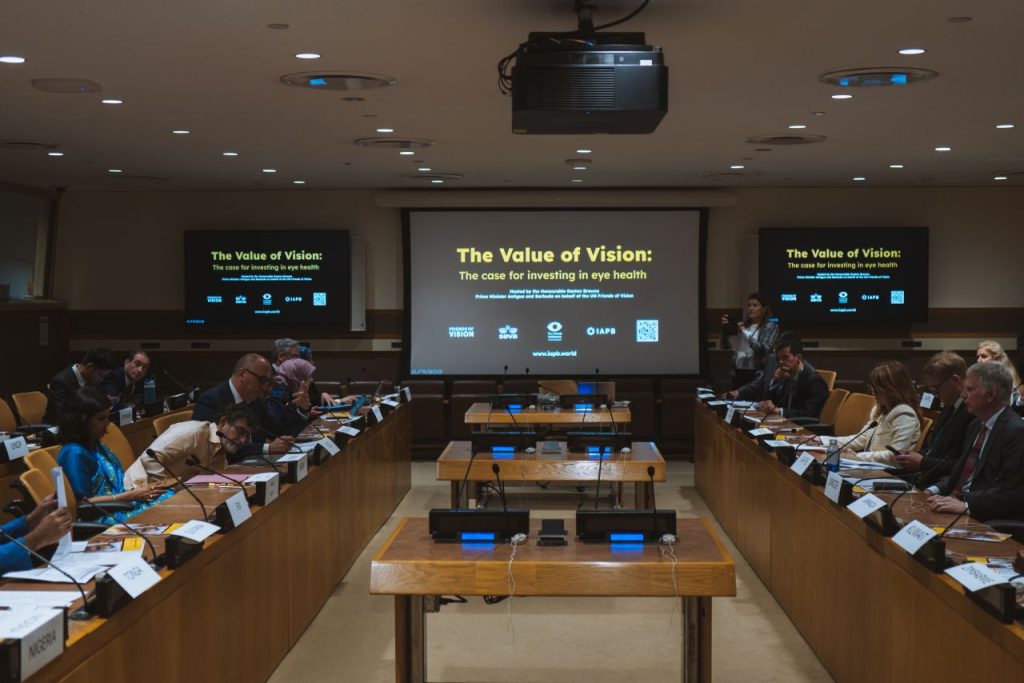
Join the Leading Global Eye Health Alliance.
Membership-
Choose an alternate language here
- Membership
A Q and A with Jack Hennessy on the topic of Transforming Lives: An investment case for eye health
The Fred Hollows Foundation’s investment case was developed to ‘make the case’ for investment in eye health. Investment cases as an evidence tool have been popular over the past decade or so, but in eye health we had typically focused on demonstrating the cost-effectiveness of interventions (e.g. cataract surgery, correcting refractive error) rather than directly comparing the costs and benefits associated with treatment.
Essentially, our investment case models the costs and benefits of meeting the World Health Assembly targets for effective cataract surgical coverage (eCSC) and effective refractive error coverage (eREC) across 19 countries where The Foundation works, and the burden of eye disease is high. Using ingredients-based costing data from our country programs, disaggregated prevalence data from the Vision Loss Expert Group, and of economic and educational data, we estimate the economic return on investment for eye health interventions, focusing on improved labor force participation, productivity in the workforce, and additional years of schooling.
As our report relies on country-specific data, we found the most reliable evidence existed for three benefit pathways: increased labor force participation, increased productivity at work, and increased returns of education for school-aged children.
We did not include additional benefits of eye health interventions such as health system savings (e.g. through averted falls), forgone employment that people may experience caring for family members with eye conditions, or benefits to social participation that many individuals who receive eye health interventions may experience. This decision was made in consultation with an expert review panel, who found that for the 19 countries included in the model, the most reliable evidence was based around returns to work and schooling, as included in our model.
The Fred Hollows Foundation report is the first of its kind to leverage ingredients-based costing data from our programmatic operations to develop a return-on-investment model for cataract and refractive error treatment. Working closely with our implementing partners, we collected costing data for inputs such as human resources, equipment and consumables, and additional health-systems-based costs to develop weighted unit costs for treatment of both cataract and refractive error across the different contextual environments where we worked.
We leverage findings from estimates of productivity loss and labor force participation published by leaders in the sector, including those driven by the International Centre for Eye Health in collaboration with several leading researchers around the world.
This allowed us to develop the first report estimating return-on-investment for cataract and refractive error based on the costs and benefit pathways outlined above.
Meeting the WHA goals for 2030 across the 19 countries in this study will mean treating over 39.9 million people with cataracts equivalent to more than 117.9 million years of sight saved (YSS) at a total discounted cost of USD $28.4 billion. The average ROI measured by the BCR is 20.5, with significant variation from country to country. This means that, on average, the cataract treatment program will return USD $20.50 for every dollar spent on the program. The BCR is lowest in China at 7.7 and highest in Kenya at 52.1. Most countries fall in the range of 10 to 20.
For myopia, meeting the same WHA goals would mean delivering the equivalent to more than 282.8 million YSS at a total discounted cost of USD $67.9 billion. The average ROI measured by the BCR is 10.5 with significant variation from country to country. The BCR is lowest in Burundi at 2.7 and highest in Lao PDR at 33.2.
For presbyopia, meeting the same WHA goals will mean treating over 232.9 million people with presbyopia equivalent to more than 223.2 million YSS at a total discounted cost of USD $240.8 billion.
The average ROI measured by the BCR is 8.0 with significant variation from country to country. The BCR is lowest in Burundi at 2.1 and highest in Lao PDR at 21.9.
We are confident that the results give a good indication of the broader return-on-investment of eye health conditions across the globe. Indeed, using the Global Burden of Disease database to estimate the burden of disease for cataract and refractive error (as measured by disability adjusted life years and prevalence of eye conditions) we found that the 19 countries included in our model account for over 40% of the global burden of disease.
However, it is important to note the significant variation from country to country estimated in our report. The key differences in outcomes for countries reflect the differences in incidence of eye health conditions by age and sex and the relative cost of treating these conditions, the average productivity within a country, and differing labor force participation rate by age and sex. As such, additional research is required to understand the individual return-on-investment for eye health interventions for countries not included in our model, and to quantify additional benefits as this evidence becomes more widely available.
Years of Sight Saved (YSS) is an eye-health specific impact measure that The Fred Hollows Foundation has been developing to estimate the impact of eye health interventions in a standardised way. The concept of YSS is similar to that of a disability adjusted life-year (DALY) avoided, but uses ratios based on the change in disability weights (rather than the specific weights themselves) to account for the fact that disability weights associated with eye health appear to miss the mark in accurately measuring the impact of blindness and vision loss in those with eye disease.
Essentially, one YSS represents one year a person lives with full sight, when they would have lived as a person who is bilaterally blind. It is a standardised way of quantifying eye health interventions, taking into account individuals with a range of pre-operative visual acuities and post-operative outcomes.
As the economic benefits in this report are calculated more broadly than a typical ROI calculation (which calculates returns to the investment provider alone), the most appropriate way of comparing benefits to costs is the benefit cost ratio (BCR) in which discounted benefits are divided by discounted costs.
The costs for refractive error treatment are higher in seven of the 19 countries included in the model, which can be counterintuitive when considering a unit cost estimated based on the cost of a single pair of spectacles alone. However, our ingredients-based costing approach was driven by our programmatic data derived from countries where we are implementing comprehensive refractive error provision programs, which include school eye health models, outreach models, and static health service delivery at primary vision centres or eye units within hospitals. As such, we develop a weighted average on the ‘real-world’ costs of delivering comprehensive refractive error services including training costs, supervision, monitoring and reporting, which typically may not be included in the unit cost estimates in less complex models. Essentially, we took a deliberate health-systems based to estimating service provision based on real-life activities to enable the closest comparison to scale-up of refractive error service costs in the countries included in the model.
In addition, we used disaggregated data from the Vision Loss Expert Group to estimate prevalence (and incidence) at the 5-year age and sex groups within countries. For countries with low refractive error prevalence, the number of individuals estimated to be screened prior to finding individuals to enter a treatment pathway is significantly higher than countries where prevalence is lower, hence, for some of these countries the cost per person receiving glasses is higher.
The results provided in this study indicate that for most countries there are strong returns in the form of economic benefits from implementing programs that meet the WHA goals for cataract and refractive error. Indeed, the large average BCR estimated for cataract surgery alone (20.5) shows that this procedure provides among the highest ROI of any disease interventions modelled through investment cases.
In a study with WHO, for a range of interventions addressed at reproductive, maternal and child health for 75 low- and middle-income countries the BCR was estimated to be 8.7 (Stenberg et al 2014). For treating depression and anxiety the BCR was 4.0 (Chisholm et al 2016) while for cardiovascular disease it was 10.9 (Bertram et al 2018). Clearly, returns-on-investment for eye health interventions are among the highest estimated through similar investment cases.
However, our report focuses on ambitious goals agreed upon at the World Health Assembly. As additional tools are developed to consistently measure eCSC and eREC across the globe, our sector will be able to work together to develop additional evidence on our progress and understand the critical need to increase investment in and prioritisation of eye health by governments and donors alike. This tool is an essential piece of the puzzle, but we must continue to work together to drive change for some of the world’s most vulnerable populations.